Example 3 - Using the Wealth Builder
Step 1 Use the investment property used as Example 1 in the Users Guide
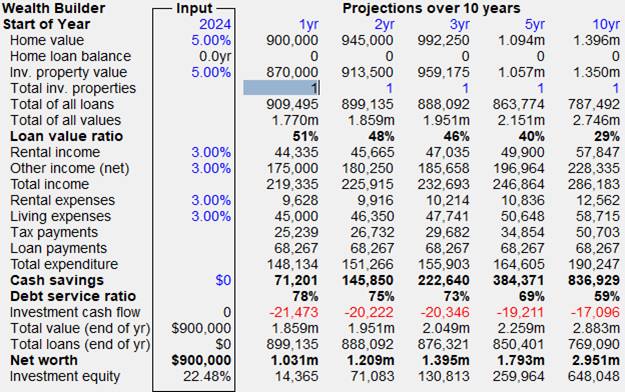
Lets assume you have been through all the steps in the Example of a commonly geared investment property as set out in Example 1 of this Tutorial section. To check that you are using the same spreadsheet, go to the investment analysis spreadsheet and check that the property value is $870,000 and the Rate of Return (IRR) is 22.48% over 10 years. The Wealth Builder will assume that in future years, you will be buying multiples of this particular property.
Choose the Data Entry Check List (Toolbar ![]() Menu: View/Data
Entry Check List.) and click on the Principal Residence item under the Investor
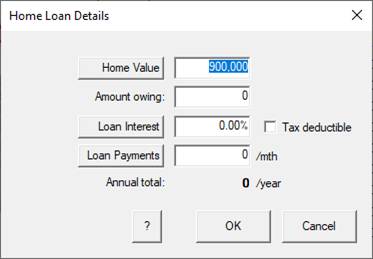
tab. In the Home Loan Details dialog set thevale of the home to 900k and the
remainder of the variables to zero. Click OK to return to the Investment
Analysis spreadsheet.
Menu: View/Data
Entry Check List.) and click on the Principal Residence item under the Investor
tab. In the Home Loan Details dialog set thevale of the home to 900k and the
remainder of the variables to zero. Click OK to return to the Investment
Analysis spreadsheet.
Now choose the Wealth Builder spreadsheet (Toolbar ![]() Menu: View/Wealth
Builder.) The spreadsheet you will see will begin with a Home Value of
$900,000, a Home Loan Balance of 0 (the home loan is assumed to be paid out),
an Investment Property Value of $870,000 (as set in the Investment Analysis
spreadsheet) and the Total properties showing in the first year will be showing
as 1.
Menu: View/Wealth
Builder.) The spreadsheet you will see will begin with a Home Value of
$900,000, a Home Loan Balance of 0 (the home loan is assumed to be paid out),
an Investment Property Value of $870,000 (as set in the Investment Analysis
spreadsheet) and the Total properties showing in the first year will be showing
as 1.
Step 2 Check the Cash savings, current Loan to Value Ratio and Debt Service Ratio
Lets now check some of the key parameters to see if the number of properties showing in the Wealth Builder in the 1st year column - Total inv. properties row and the number of properties calculated previously in the Investment Capacity correspond in the first year. Lets start with the number of properties set to 3.
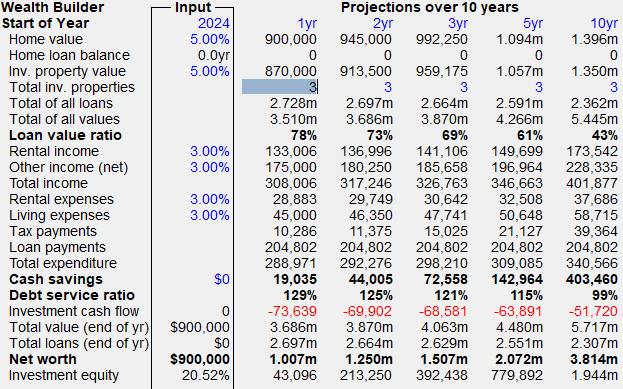
If we look down the first year to Cash Savings, we see that they are in the black at $19,035 and hence the investor could just afford to purchase 3 investment properties as already determined by the Investment Capacity Screen. However, if we check the two key indices of Loan Value Ratio and Debt Service Ratio, the indices commonly used by lending institutions, we see a slightly different story. The Loan to Value Ratio is showing at 78%, a figure that would probably be acceptable to a lending institution even without mortgage insurance, and the Debt Service Ratio is showing at 129%, a figure higher than many lending institutions would accept. Some lenders, however, may approve the loan on the basis of a different method of calculating the Debt Service Ratio or based on the investors own presentation of income and expenditure. For the purposes of the Wealth Builder we will adjust the number of properties able to be purchased so that the Loan Value Ratio remains below 80%, and the Debt Service Ratio falls below 100%, but remember that they should only be used as a guide and not an absolute yes or no loan approval.
Step 3. Change the Spreadsheet to a Credit Line.
With cash savings of $19,035 it is important to be able to
make the best use of this money, before it is spent. We suggest that investment
loans should be taken out in two parts. The first of about three quarters of
the total loan should be interest only with a fixed rate. The second smaller
loan should be taken as a credit line to allow the cash savings to be useful in
debt reduction while awaiting the purchase of another property. So the next
step is to change the Wealth Builder to a Credit Line, so that all future Cash
savings will then be used to reduce the total loan. To do this, choose the
Credit Line icon from the Toolbar (![]() ) or
Menu (Settings/Credit Line) and click. The heading at the top left now shows
Wealth Builder (CL), to indicate the Credit Line is now in use. Several important
changes have now taken place.
) or
Menu (Settings/Credit Line) and click. The heading at the top left now shows
Wealth Builder (CL), to indicate the Credit Line is now in use. Several important
changes have now taken place.
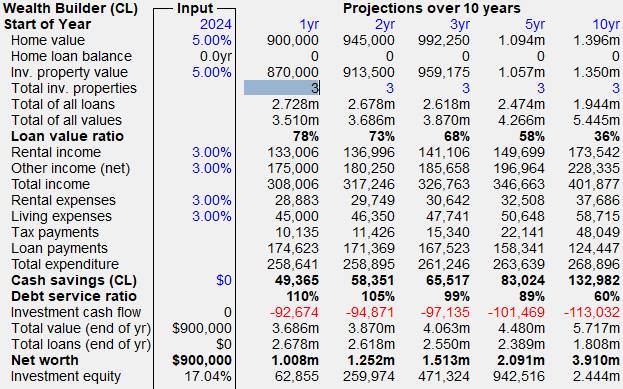
Firstly, the Loan Value Ratio remains unchanged at 78%, as you would expect as the cash flows do not affect the initial loans and property value.
Secondly, the Cash Savings have now increased from $19,035 to $49,365 because the Wealth Builder now assumes that the first part of the loan has been changed to interest only, reducing the loan payments from a total of $204,802 to $174,623.
Thirdly, the Debt Service Ratio has now been reduced from 129% to 110%, primarily because of the use of the Interest Only Loan Payment in the Debt Service Ratio Calculation. The use of an Interest Only Loan in assessing Affordability is very important as the loan payments are a key component in its calculation and any reduction in payments will improve the index. However the Debt Service Ratio is still too high so the only course of action is to reduce the number of properties. Change it from 3 to 2.
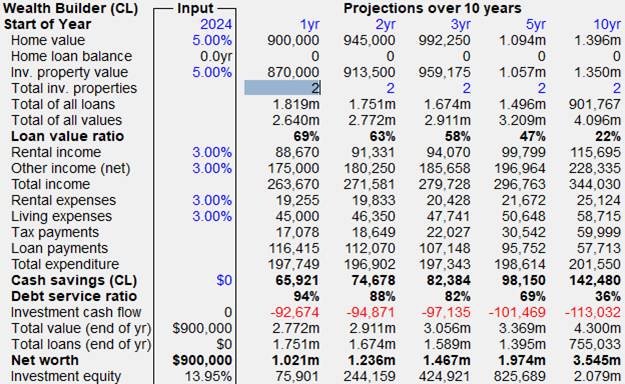
The Loan Value Ratio drops to 69% and the Debt service ratio to 94% - a much more acceptable figure to lenders.
The Total loans owing at the end of the first year, which is shown in the third bottom row of the First year, has now been reduced from $1,819 million to $1.751 million because the cash savings have now been used to reduce the loan. Notice how the difference between the two is not exactly equal to the cash savings of $65,921, because the Wealth Builder assumes that the savings are added to the loan throughout the year reducing interest along the way.
With the Credit Line option invoked, the cash savings in the First Year ($65,921), indicates that the investor can easily afford to buy the 2 investment properties in the first year. But what about the other two indicators. The Loan to Value Ratio (69%) and the Debt Service Ratio ( 94%) are now both low enough to make the loan acceptable to most lending institutions. As a test to see why it is so important to have an Interest Only Loan, go back up to the top and choose the Credit Line icon and switch it backwards and forwards while watching the Debt Service Ratio switch between 111% and 94%. In other words, the use of the interest only loan with a credit line has produced a much lower Debt Service Ratio and could mean the difference between getting and not getting a loan.
Step 4. Adjust the Total properties from year 2 onwards
Notice that every time you change the Total number of properties in the first year, the number of properties in the subsequent years also alters. So with 2 properties now showing in the first year, the subsequent years of 2,3,5 and 10 are showing at 2,2,2 and 2 properties. To gain a better insight as to what is happening in the years not shown on this screen, it may be better to change the screen to showing the first five years instead of years 1,2,3,5 and 10. To do this, you use the left mouse button to click on Start of Year at the top left corner of the spreadsheet below the Wealth Builder name. This opens up a dialogue box where the button will be currently set on the second row showing 10 years (1,2,3,5,10). Use the left button on the mouse and click on the top button showing 5 years (1,2,3,4,5) and then click OK. The Wealth Builder Spreadsheet now shows the consecutive years of 1,2,3,4,5 across the top and we will now be able to complete the Total properties in the years that were previously not shown.
Now we are ready to change the number of properties in the second year.
2nd yr Column, Total Inv. properties row
Look at the second year column. The Cash savings are large at $74,678, indicating a good situation and the Loan to Value Ratio has fallen to 63% (with the increase in the property values and the reduced loan) while the Debt Service Ratio has also fallen to 88% (with the increases in rents, wages and the reduction in interest payable). The question is, can we afford to buy another investment property in the second year?
With the left mouse button, click on the 2 in the 2nd year column - Total properties row and change it to 3. According to the Cash Savings of $56,654, the purchase of another investment property is easily affordable. However, how do the two indices stack up? The new Loan to Value Ratio is now 73%, still within acceptable limits, but the Debt Service Ratio is now 106%, a little over the top for some lenders, but perhaps acceptable to others. To be conservative, let us change the Total properties purchased back to 2 in the second year, by once again clicking on the 3 in the 2nd year column - Total properties row, or by clicking the Undo icon in the toolbar.
Now lets see what happens if we try to buy another property in the third year.
3rd yr Column, Total Properties row
Look at the third year column, where the Total Properties is showing at 2. The Cash savings are showing at $82,384, the Loan to Value Ratio is showing at 58%, and the Debt Service Ratio is at 82%. Now use the mouse to click on the Total properties in the third year and change it to 3 and hit enter. The Cash Savings look good at $62,820, the Loan to Value Ratio is good at 69%, but the Debt Service Ratio is 102%, a little over the limit. Again, it would be a matter of finding a lender and presenting a good case to gain approval, but for now we will be ultra conservative and switch the 3 properties in the third year back to 2 and try again next year. Lets now move on.
Future Columns, Total Properties row
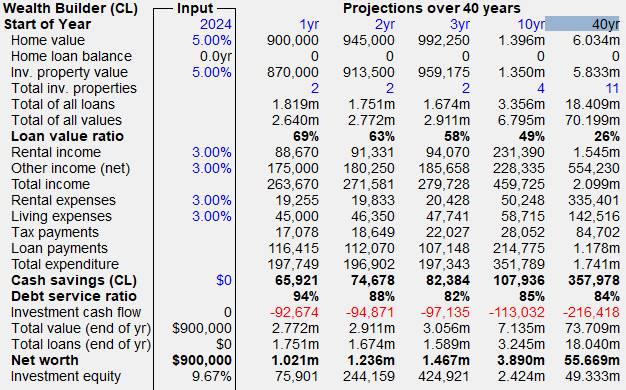
You can continue to change the number of properties across the spreadsheet year by year, with subsequent years accessed by either using the keyboard arrow keys to move to the right, or by clicking on the double arrow icon in the tool bar to bring up the next set of 5 years. If you have chosen the number of properties to produce Loan to Value Ratios of less than 80% and Debt Service Ratios of less than 100%, by the 10th year you should finish up with 4 investment properties.
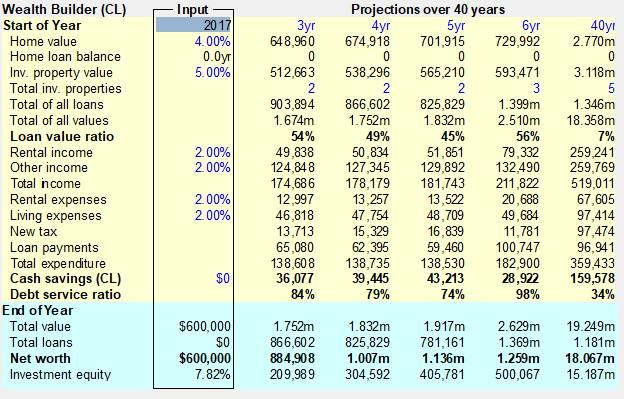
A short cut to this end is to use the Maximise Wealth Builder item under the Investor menu. In this process, you will be asked to specify the constraints on cash savings, Loan Value ratio and Debt Service ratio. This will do the calculations right up to 40 years, by which time you would finish up with 11 investment properties.
Step 5. Tips and Tricks in using the Wealth Builder.
In most cases, the purchase of further properties is limited by the Debt Service Ratio, not the Loan to Value Ratio. So it is desirable to reduce this Index to its lowest level. The formula used in the Wealth Builder is as follows:
Debt Service Ratio = (Loan Payments X 100%) / (30% wages + 80% Rent)
So the trick is to minimise loan payments and maximise wages and rent. Some tips in doing this include:
Loan Payments: Make sure all loan payments are either interest only or at least a long term Principal and Interest. This might mean refinancing a home loan to a longer term. (You can still pay it off at the rate of knots but you are not committed to doing so.) Refinance personal loans and car loans to longer terms, or consolidate with the home loan to reduce the deemed payments. Get rid of any excess credit cards as these are deemed to incur payments as well.
Wages: Make sure you include ALL income from all sources. While reducing your tax and minimising your living expenses will improve your cash savings, it does not affect your affordability because a set percentage of 30% (or more or less) is used regardless of your spending habits.
Rent: Make sure rents are maximised as this too is a set percentage, with the assumption that 20% of rent is allocated to expenses. So while reducing your expenses may improve your cash flow, it doesn't necessarily improve your Debt Service Ratio.